The new foreign tariff calculation, the estimate of the total foreign tariffs on U.S. goods released by the Trump Administration (hereafter the Administration) to justify the new tariffs, is a great case for beginners like me (and possibly you) to see if I could duplicate their work.
There are links to everything if you would like to recreate this yourself. You will need some basic Excel skills such as formulas, filtering, mass copying of formulas, and formatting columns as percentages.
The Administration’s Rationale
The Office of the United States Trade Representative has published the Reciprocal Tariff Calculations. I encourage you to read it. It is very short. However, here are two assumptions that are critical to the calculation approach:
- The calculation assumes that the persistent trade deficits are due to a combination of tariff and non-tariff factors that prevent trade from balancing.
- Individually computing the trade deficit effects of tens of thousands of tariff, regulatory, tax, and other policies in each country is complex, if not impossible. However, the Administration believes that these combined effects can be proxied by computing the tariff level consistent with driving bilateral trade deficits to zero (emphasis added).
Whatever the veracity of that assumption, it does make it very easy to apply a single formula to a single data set to arrive at the Administration’s end result.
Calculating the Tariff Changes
This is the calculation used to meet the objective outlined above:
\[ \Delta \tau_i \;=\; \frac{x_i – m_i}{\varepsilon \,\phi \,m_i} \]
Where:
- \(\Delta \tau_i\) is the change in the tariff rate on imports from country \(i\).
- \(\epsilon\) is the (negative) elasticity of U.S. import demand with respect to import prices. The Administration calculated this value to be 4.
- \(\phi\) is the pass-through from the tariff to import prices. The Administration calculated this value to be 0.25
- \(m_i\) is total U.S. imports from country \(i\).
- \(x_i\) is total U.S. exports to country \(i\).
- \(i\) is the country trading with the U.S.
Plugging in the values we have so far (\(\phi\) is 0.25 and \(\epsilon\) is 4), replacing \(n_i\) with “imports”, and replacing \(x_i\) with “exports” , we get the following equation:
\[ \Delta \tau_i \;=\; \frac{ exports – imports }{ 4 * 0.25 * imports} \]
Since 4 * 0.25 = 1, we can further simplify to this for each country:
\[ \Delta \tau_i \;=\; \frac{ exports – imports }{ imports} \]
Getting The Data
The data used here has been compiled by the U.S. Census Bureau. The U.S. Trade in Goods by Country site can be found here. This download link will download the data in excel to your device. The file, named country.xlsx, contains all the goods export and import amounts for every country the U.S. trades with for the years 1985 through February of 2025.
Most of the info on the spreadsheet is not needed. We only need the following four columns from this spreadsheet and only information from 2024.
- The year
- The Country Name
- The year total for imports
- The year total for exports
To get the spreadsheet ready for our calculations, open the spreadsheet and do the following:
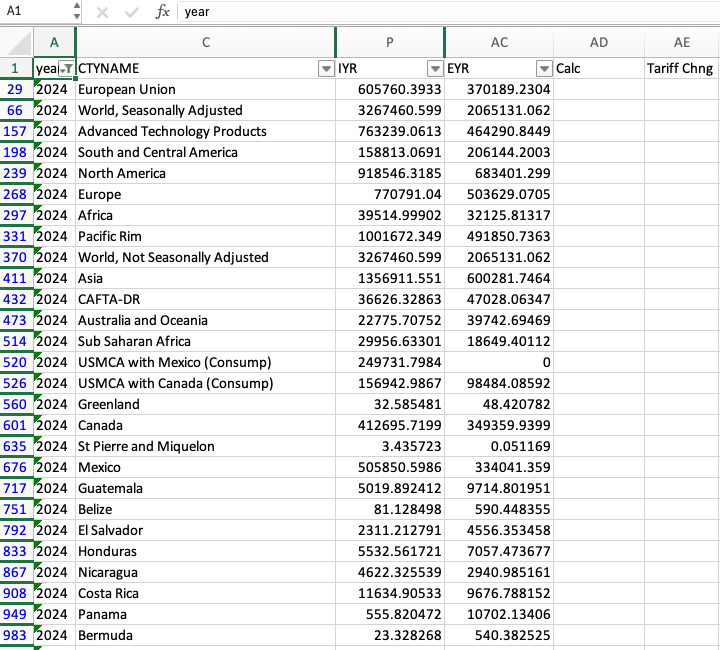
- Hide all the columns except Column A (year), Column C (CTYNAME), Column P (IYR), and Column AC (EYR).
- Filter on year (Column A) and select 2024.
- In Column AD, create a new heading Calc.
- In Column AE, create a new heading Tariff Chng.
- Format Column AE values to Percentage with 0 decimal places
The spreadsheet should look like this now:
How to Calculate
Calculating the tariff change is simple:
In cell AD29 enter the following formula: =(AC29 – P29)/P29.
a. AC29 is the value of all exports to the country from the U.S.
b. P29 is the value of all imports to the U.S. from the country
- Mass copy the formula to every AD29 row with import/export data
Now we have all the tariff changes calculated to many decimal places. Countries with a negative number export more than they import from the U.S. Conversely, countries with apositive number import more from the U.S. than they export to the U.S.1 We just have a little bit of clean-up to do.
In cell AE29 enter the following formula: =-AD29. Then mass copy the formula to every row with an AD29 value.
This will turn those negative values for countries with surpluses with the U.S. to a positive percent to add to existing tariffs. It will also turn tariff percentages negative for countries that run a deficit with the U.S. Since we previously formatted column AE as a percentage with no decimal places, we should have our final values. Here is what I have:
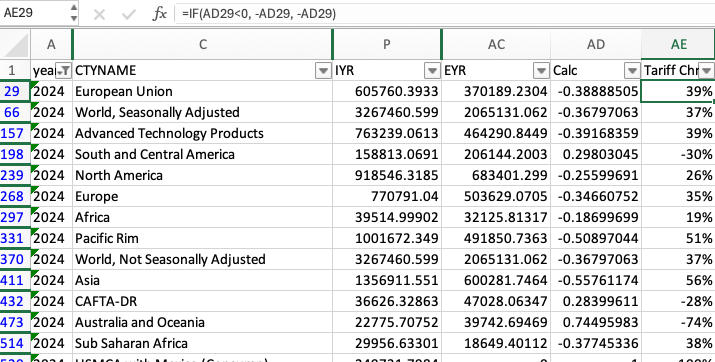
This will provide you with the actual tariff change percentages for a given country that the Trade Office formula provided. A positive percentage occurs if the U.S. is running a deficit with the country. A negative percentage occurs when the U.S. is running a surplus with the country.
Verifying Our Calculations
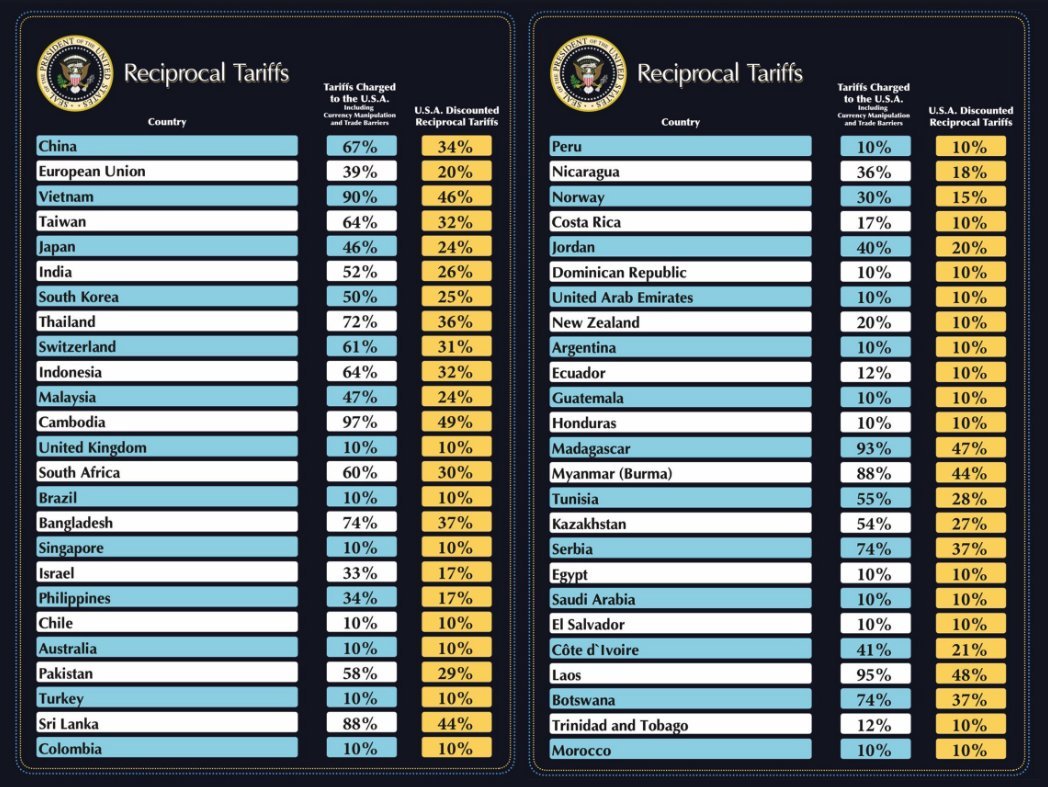
Although we calculated the tariff changes for every entity on the spreadsheet, the Administration tariffs apply to a subset of these countries. This list can be found, along with the new reciprocal tariff in ANNEX I of Executive Order 14257 on reciprocal tariffs.
We have images from the President’s presentation that provide a number of country’s tariff change percentage and the U.S. reciprocal tariff.
My results are in Table 1 below. The green rows are matches. The red rows are mismatches. The mismatches can be easily explained. All but one are from countries with which the US runs a surplus. This led to a negative value for the tarrif change. For any calculated change that is less than 10%, the Administration replaced the calculated value with 10%. This was even seen with Turkey, the only mismatch with a positive change calculation. I calculated a 9% tariff change required but the Administration again had 10%. I rechecked the math and I did not make a mistake. This was another case of setting the floor at 10%.
As expected, I matched on all the countries in Annex I. These would be countries with large surpluses and whose tariff change exceeded 10%.
Here is all the information (presented in the order of the countries in the image above). Here is a downloadable copy of my spreadsheet.
| Country | Admin Calc | My Calc | Annex I |
|---|---|---|---|
| China | 67% | 67% | Y |
| European Union | 39% | 39% | Y |
| Vietnam | 90% | 90% | Y |
| Taiwan | 64% | 64% | Y |
| Japan | 46% | 46% | Y |
| India | 52% | 52% | Y |
| South Korea | 50% | 50% | Y |
| Thailand | 72% | 72% | Y |
| Switzerland | 61% | 61% | Y |
| Indonesia | 64% | 64% | Y |
| Malaysia | 47% | 47% | Y |
| Cambodia | 97% | 97% | Y |
| United Kingdom | 10% | -17% | N |
| South Africa | 60% | 60% | Y |
| Brazil | 10% | -17% | N |
| Bangladesh | 74% | 74% | Y |
| Singapore | 10% | -7% | N |
| Israel | 33% | 33% | Y |
| Philippines | 34% | 34% | Y |
| Chile | 10% | -10% | N |
| Australia | 10% | -107% | N |
| Pakistan | 58% | 58% | Y |
| Turkey | 10% | 9% | N |
| Sri Lanka | 88% | 88% | Y |
| Colombia | 10% | -8% | N |
| Peru | 10% | -20% | N |
| Nicaragua | 36% | 36% | Y |
| Norway | 30% | 30% | Y |
| Costa Rica | 17% | 17% | N |
| Jordan | 40% | 40% | Y |
| Dominican Republic | 10% | -74%* | N |
| United Arab Emirates | 10% | -261% | N |
| New Zealand | 20% | 20% | N |
| Argentina | 10% | -29% | N |
| Ecuador | 12% | 12% | N |
| Guatemala | 10% | -94% | N |
| Honduras | 10% | -28% | N |
| Madagascar | 93% | 93% | Y |
| Myanmar (Burma) | 88% | 88% | Y |
| Tunisia | 55% | 55% | Y |
| Kazakhstan | 54% | 54% | Y |
| Serbia | 74% | 74% | Y |
| Egypt | 10% | -139% | N |
| Saudi Arabia | 10% | -3% | N |
| El Salvador | 10% | -97% | N |
| Côte d’Ivoire | 41% | 41% | Y |
| Laos | 95% | 95% | Y |
| Botswana | 74% | 74% | Y |
| Trinidad and Tobago | 12% | 12% | N |
| Morocco | -177% | 10% | N |
Final Thoughts
This was mainly an excercise to duplicate some very basic calculations. But the real question is whether the approach taken by the Administration serves as a valid stand in for all the tariffs, regulatory, tax, and other policies for the country in question. Others have laid out the arguments, for and against, much better than I could ever do. I will just say that there are fewer supporters of this approach than there are opponents and I find the opponents’ arguments much more compelling.
But just looking at the data and the calculations, Even assuming that the approach used by the Administration is correct, there are questions to be asked.
First, given the model, the calculations with the surpluses don’t justify the Administration’s response. Why is the tariff change for the United Kingdom 10%? We run a surplus with the UK. In fact, according to this approach, the UK should increase tariffs by something approaching 9% and the U.S. should be OK with that. The same is even more true of Australia which should be increasing tariffs by whopping 54% – and, again, we should be OK with that. At the very least, this model seems to indicate a very level playing field – so should we be repealing any (or all) U.S. tariffs on these countries’ goods? It would be a powerful indication that the Administration really believed in this approach.
Second, Annex I and the presentation materials omit certain countries that should be on the list based on this formula. These countries are Afghanistan, The Faroe Islands, Russia, and Belarus.2 Maybe Russia and Belarus are covered by sanctions but they should also be on the list – as should Afghanistan and the Faroe Islands (which I know nothing about). If these countries get a pass there should be some explanation of the rationale for these decisions – and why the rationale only applies to these countries.
Finally, this spreadsheet only includes goods. Services are not included. How can the US set trade neutral tariffs if it doesn’t include everything the US trades with other countries?